When you read a regular newspaper, blog or well-respected magazines, online or on paper, you get an idea that most Multinationals are not paying any taxes and that they can shift their profits wherever they want.
Having been an international tax adviser for over 16 years, I know that this statement is not right and I have also noticed that most articles written by journalists about global taxation are besides being totally incorrect, they are mainly driven by emotions, misunderstandings and written for the shock effect for tricking readers.
To be clear, this post is not written by me to defend the Multinationals. My main intention is to try to explain how you normally determine what profits to tax in which country and I have written it for non-tax specialist so I have tried to avoid professional jargon and keep it simple as possible. The only downside of this is that it has become a long read because I have tried to explain the process in a step by step basis. So you better get a comfortable chair.
For a better discussion about taxation of Multinationals, it is useful to understand how taxation of global businesses work and I have used the global fight for Apple’s profits as an example.
Via this post I will try to explain:
-
- Why tax authorities are fighting for a piece of the profit cake.
-
- How Tax Authorities on a global level have agreed upon a system to come to a fair share
-
- What the value drivers are of a company and why they are so important for determining each countries fair share in the global profits of a company.
-
- Why you can have massive sales in one country without having to report massive profits in that country.
-
- Why US Multinationals, like Apple and many more, are “forced” to stall billions of profits outside the US.
- What happened in Apple’s recent EU Tax Case and why Apple did what it did.
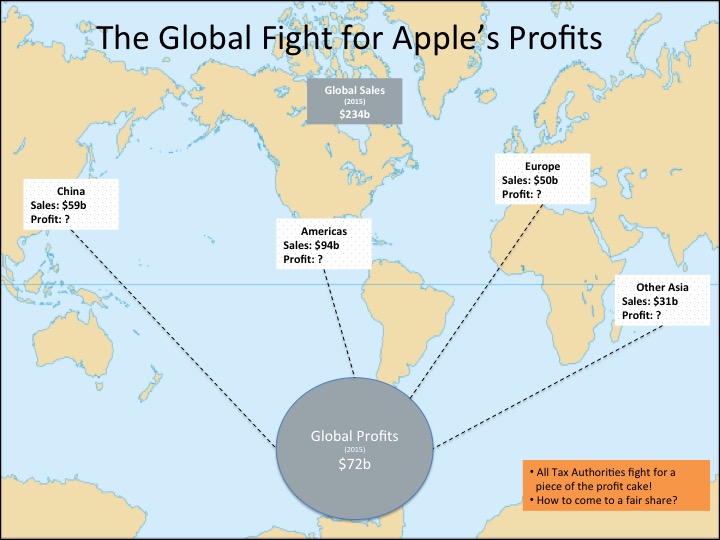
Apple’s Global Profits of $72b
How to Establish a Fair Share
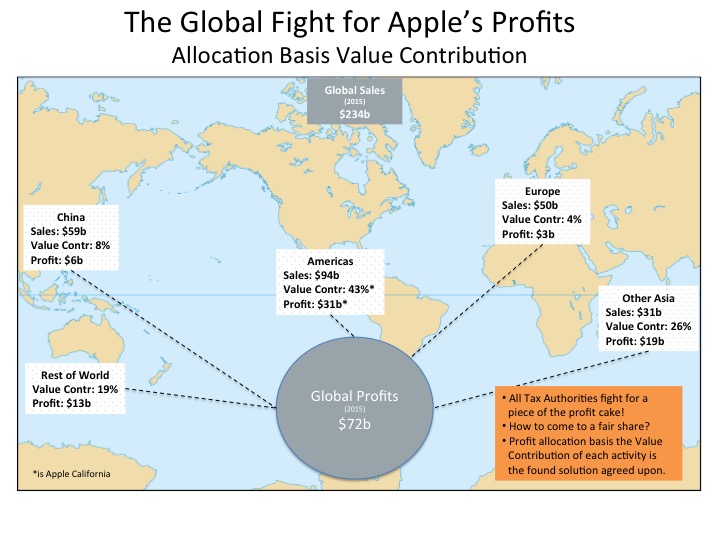
As you can see from the top picture, Apple’s 2015 global sales amounted to $234b and those sales were made in Americas ($94b), China ($59b), Europe ($50b) and various other Asian countries ($31b). These sales resulted in $72b global profits, before tax.
Those are massive amounts and you can imagine how nice it would be if you could tax part of those profits as a country. So tax authorities around the world are literally fighting for tax a piece of Apple’s global profits. But how do you determine what profits belong in what country and who decides that these profits belong to a specific country?
A good starting point is to try to find out what a company is actually doing and a common way to do this is to perform a so-called value-chain analysis.
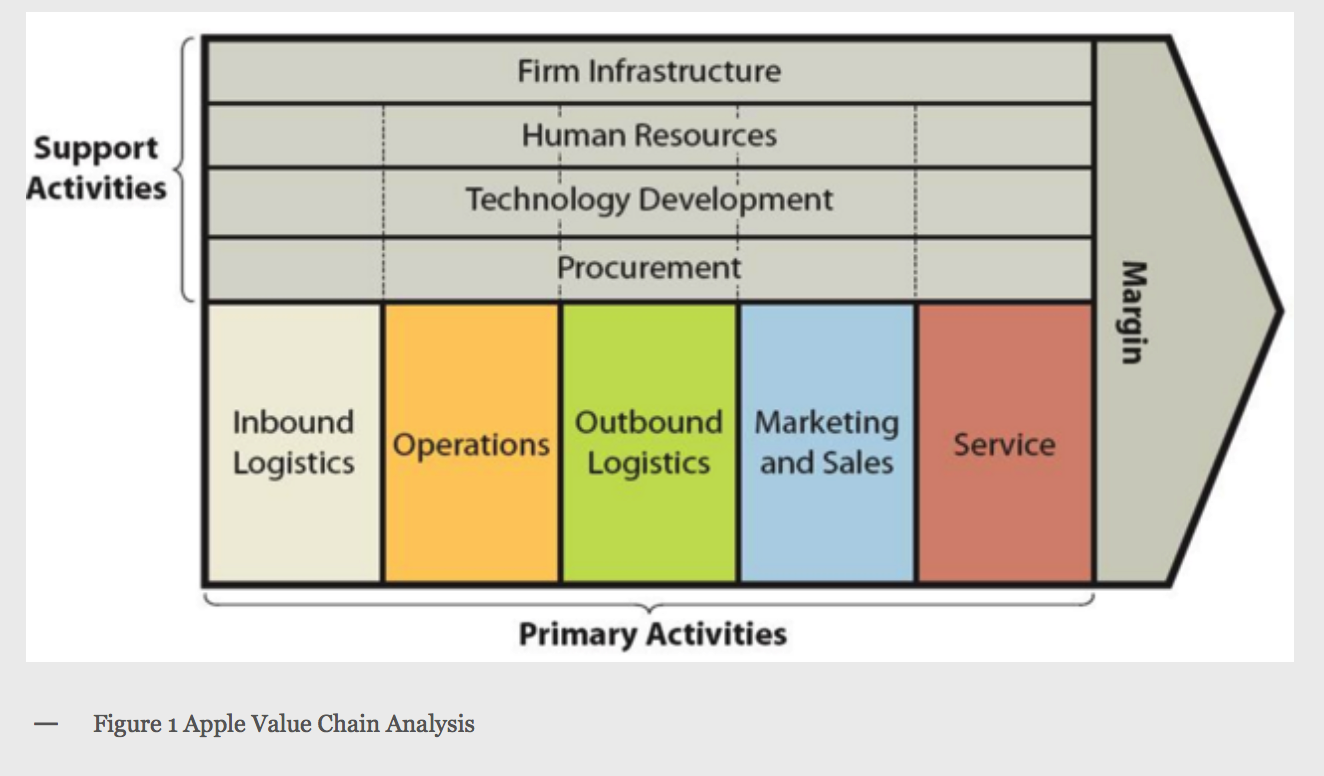
A value-chain analysis assists in identifying business activities that create value and competitive advantage to the business versus activities are more of a supportive nature.
The figure to the right illustrates the essence of a value chain analysis and if you can determine the relative importance of each department you have come a whole way.
And that is what we are going to do with Apple’s activities so let’s first identify Apple’s core activities.
Apple’s Core Activities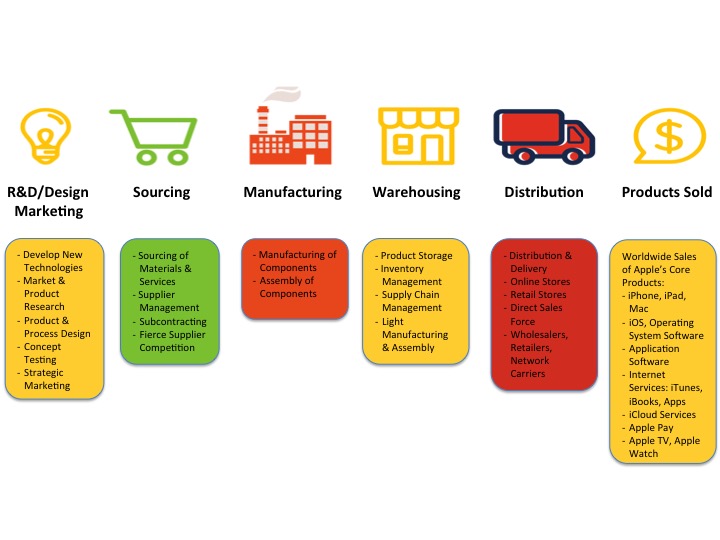
In a nutshell, Apple’s core activities are:
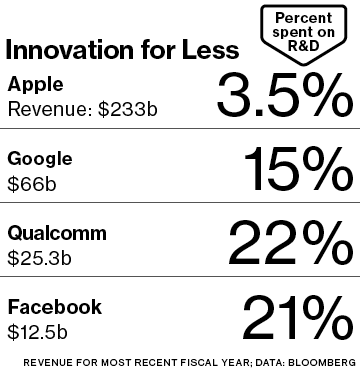
R&D / Design – Because the PC, mobile and consumer electronics industries are characterized by rapid technological developments, Apple’s ability to compete successfully heavily dependents upon its ability to bring competitive products and services to the market on a continuous basis. That’s why Apple has been a very consistent R&D spender, reporting increased R&D expenditures each year since 1998. Apple spends huge amounts on R&D, almost $2b every quarter. However, compared to other leading technology companies Apple’s R&D spending relative to its sales is modest.
Marketing – Apple has four main channels of distribution through which it sells products and services. Apple’s marketing budget is spent mainly on the use of a marketing communication mix that entails advertising, public relations, events and experiences and direct selling.
Sourcing – Apple works with hundreds of suppliers from all around the world and maintains a highly sophisticated supply-chain management model. Suppliers compete with each other on a global level.
Manufacturing – The majority of Apple’s products are being manufactured by outsourcing partners, primarily situated in Asia. A significant part of this manufacturing is performed by a small number of outsourcing partners, often in single locations. The sourced products are shipped to an assembling plant in China which turns it into a final product.
Warehousing – The assembly plant in China ships products directly to consumers (via UPS/Fedex) for those who buy from Apple’s Online Store. For other distribution channels such as retail stores, direct sales, and other distributors, Apple will keep products at its single warehouse in California and supply products from there.
Distribution – Apple sells its products and services via four channels of distribution: (i) online store, (ii) its own retail stores, (iii) a direct sales force and (iv) third-party wholesalers/ retailers/network carriers.
Products & Services Sold – Apple’s main products and services are: hardware (iPhone/iPad/Mac), operating system software (iOS), application software, internet services & platforms (iTunes, iBooks, Apps), iCloud services and other (Apple Pay, Apple TV, Apple Watch).
Apple’s Value Distribution – Among Its Core Activities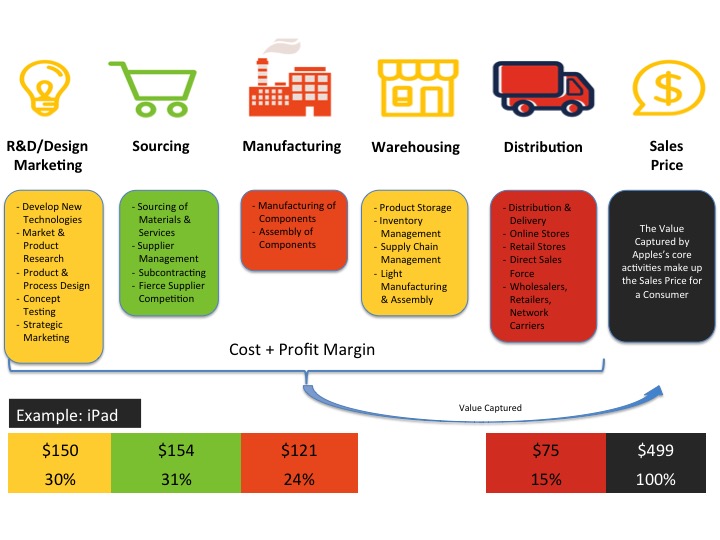
This section is the most relevant part of the whole analysis so it’s important
that you understand this fully.
Here you see what activities of Apple are the most valuable. The best way to see this is to spread out the consumer price of a typical Apple product over the core activities, in this case, an iPad which is sold for $499. As you can see Apple’s R&D/Design/Marketing and Sourcing activities add the most value to an iPad (61%) priced at $499 and the remaining value (39%) comes from Manufacturing, Warehousing and Distribution.
You may not agree with or question this value distribution but in principle that is not relevant for this analysis. The reason for this is that I am trying to explain the effects of any given value distribution on a profit distribution of a company among its global operations. So value distribution A versus value distribution B will have 2 different outcomes in profit distribution among global operations while the total profit will be exactly the same.
So for now, you have to accept this value distribution as a given fact. If you would like to know where it comes from, you can find it amongst others here: Capturing Value in Global Networks. But there are many more resources when you just Google for “Apple’s Value Chain”.
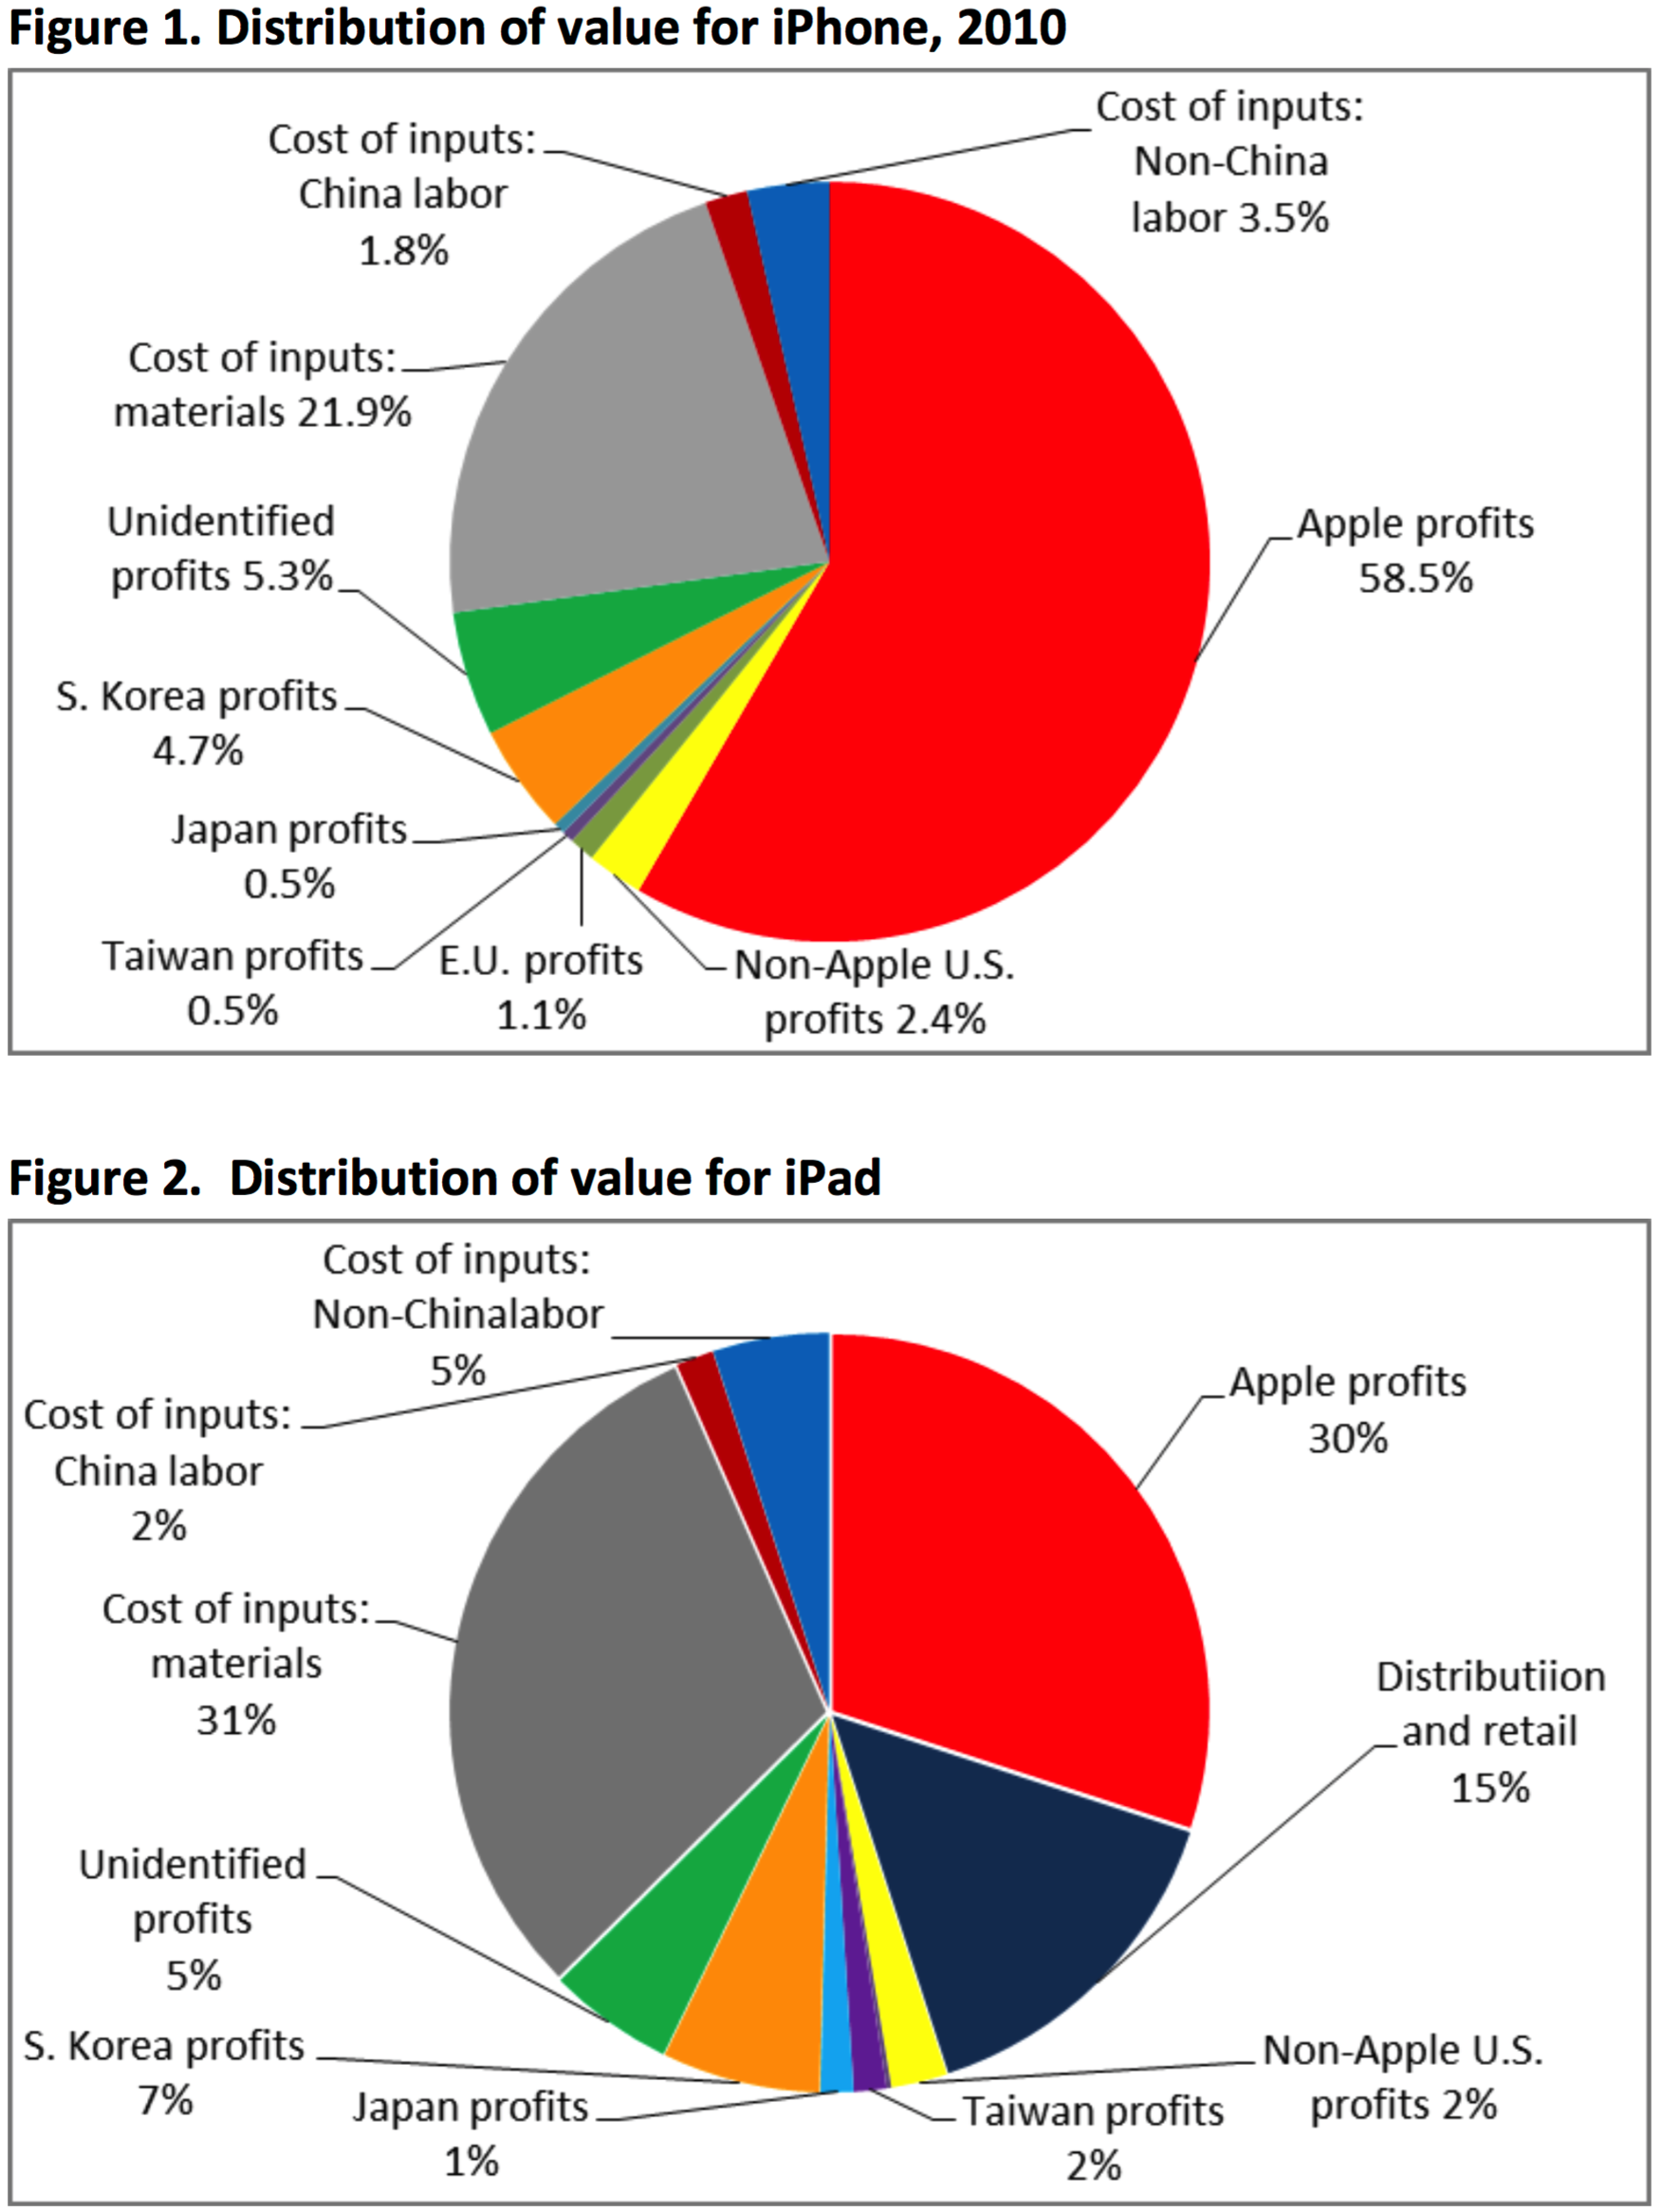
A next step is that you can see this value distribution for an iPad as Apple’s typical value distribution for all of its activities and products together. To come to this conclusion the following is important:
-
- During 2015 the iPhone (66%) and iPad (10%) accounted for 76% of Apple’s global sales as can be seen in its 2015 annual report.
-
- The value distribution of an iPhone adds even more value to Apple’s core activities in the US as you can see when comparing the value distributions for an iPhone and an iPad.
-
- The rest of Apple’s global sales relate to Services (8%) and Other Products (4%) are all either platform based or software based and these type of activities are mainly performed from out of the US.
- Taking the above into account you could even say that this value distribution is conservative and that even more value should be contributed to Apple’s core activities in the US when you talk about Apple’s typical value distribution for all of its activities and products together.
Apple’s Value Distribution
Among its Core Activities + Countries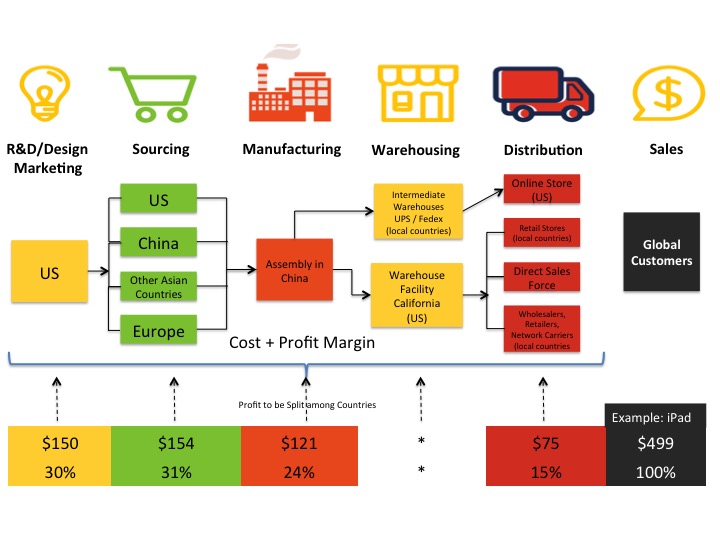
The next step is to include countries in the value distribution. This is a relatively straightforward exercise as it’s not very difficult to determine which activities take place where. The same resource is used for this: Capturing Value in Global Networks. Again, whether or not you agree with these findings in the source is not relevant for this analysis. I am just trying to show the effects a given value distribution has on profits to be reported in local countries.
As you can see Apple in the US performs all the R&D, Design and Marketing activities. Sourcing activities take place all over the world and manufacturing is mainly performed in China. Apple has only one warehouse, in the US, from which it supplies its worldwide retail stores and external retailers and wholesalers. Apple also makes use of third-party warehouses for its online sales.
Apple’s Value Distribution
More Focus on Countries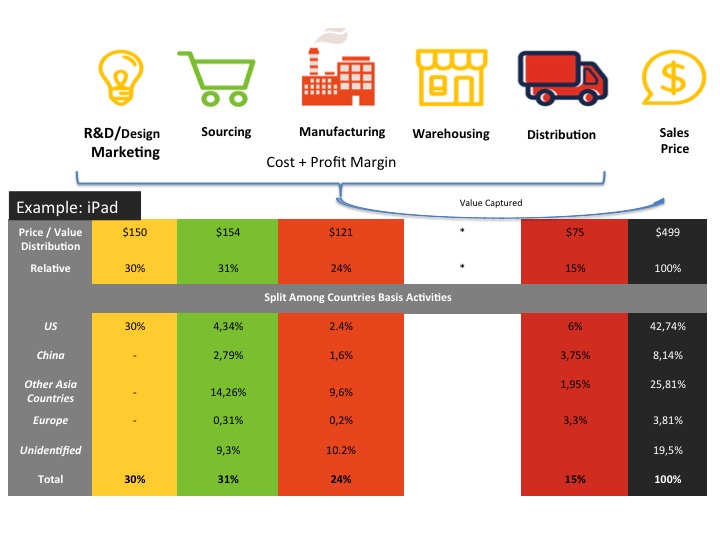
Now we start focussing more on the value distribution on a country-specific basis. It’s the exact same information as shown in the previous section, but it is only presented in a different way. Thus, the same information is used from the same source, only it is presented in a different way by starting to focus on a country by country basis.
What we can learn here is very important though. We now have insight in Apple’s core activities on a country by country basis and we know the value added per country and per core activity. Key insights here are:
-
- The US activities contribute almost 43% to Apple’s overall value chain and the US is involved in all aspects of the value chain with a strong emphasis on R&D, Design, and Marketing.
-
- The Chinese activities contribute 8% to Apple’s overall value chain.
-
- The rest of Asia contributes almost 26% to Apple’s overall value chain.
-
- Europe adds less than 4% to Apple’s overall value chain.
- Unidentified contributes almost 20% to Apple’s overall value chain. This can be countries in the rest of the world or countries already stated above, however, no further information was available in this respect.
Profit Allocation to a Country Basis Apple’s Value Distribution – Coming to a Fair Share
In the previous paragraph, we gained insight into Apple’s core activities on a country by country basis and we know the value contribution per country and per core activity. It was also stated that this insight was very important. Why is this so important?
We now know how much each country contributes to Apple’s global profits of $72b during 2015. By multiplying a country’s value contribution to Apple’s global profits of $72 you know how much profit each country should make and that is what one calls a Fair Share.
This approach gives a good idea of how much profit a company should make in a certain country. That’s why tax authorities do exactly that! They are trying to find out what the value chain is of a company and what the value contribution is of each activity of that company to determine a company’s taxable profit.
On a global basis, tax authorities in over 60 countries have even agreed on this common approach, called Transfer Pricing. At its core Transfer Pricing is about determining a company’s value chain and related value distribution. As such, most Multinationals are obliged by law to submit a so-called Transfer Pricing Report to the tax authorities on a regular basis. These reports, which can be over 100 pages long, should give insight into a company’s value chain and related value distribution.
Why Does Europe Get so Little
While Apple’s EU Sales are $50b
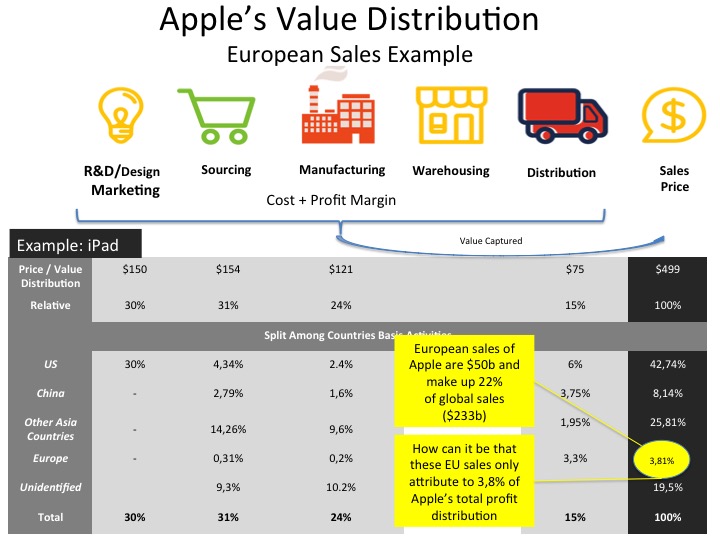
Ok, hopefully, you got the concept of value distribution and contribution. But, now let’s get back to reality again. During 2015, Apple’s European sales amounted to $50b. That is 22% of Apple’s global sales and you are telling me that Apple’s European activities account for only 3,81% of Apple’s value contribution? How is that even possible, and what is fair about that?
You should remember, however, except for selling products in Europe Apple doesn’t do a whole lot in the EU besides some minor sourcing and component assembling activities. And with respect to Apple’s sales and distribution activities, all countries in the whole world are getting a small value contribution portion. So apparently, Apple’s sales and distribution activities are not that important. But how can that be, I always thought that sales are the main profit makers for any company.
For most industries, it is the case that sales activities are a company’s most valuable activity and a value distribution scheme for these “sales intensive” industries indeed allocate most of the value (profits) to these sales activities. However, in certain industries, like (IT) Technology and Pharmaceuticals, the business value is mainly driven by its R&D activities and sales are less important.
To see why Apple’s sales activities are less important you can also look at it in this way:
-
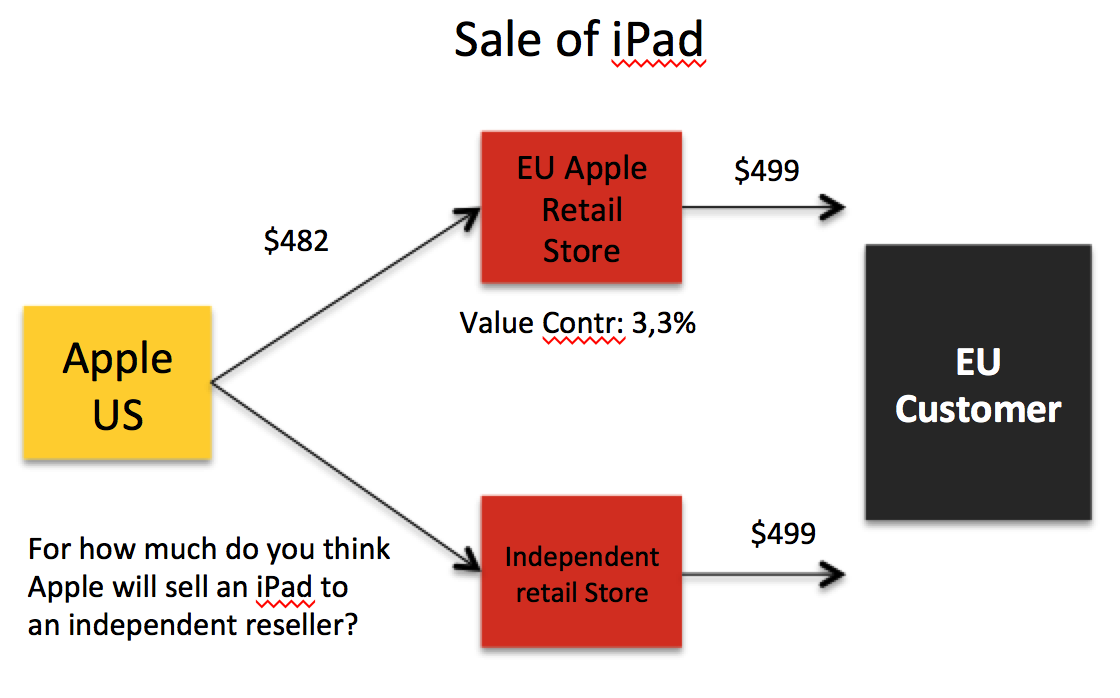
- When Apple sells an iPad to an independent retail store (not owned by Apple), like Media Market or Dixons, for how much do you think Apple will sell that iPad?
-
- That off-course depends on the volume of iPads sold and the bargaining power of that retailer.
-
- However, on average we know for how much Apple sells iPads to independent retailers and that average amount is $482. Apple just has to look into its administration and see what prices it has charged on average when selling iPads to independent resellers.
-
- This average amount of $482, is what actually determines the price Apple US charges when it sells an iPad to its European Apple Retail Store.
-
- Thus Apples US charges the exact same price for products sold to its own Apple retails stores as it charges towards independent retail stores like Media Market or Dixons.
-
- To be more precise, Apple is forced by law to charge these prices towards its own retail stores basis the earlier mentioned Transfer Pricing rules.
- And that is also how Apple’s value contribution of 3,3% has been determined for its distributions activities. This 3.3% is the same profit margin independent retailers make on these type of products.
Another way of looking at it is to just look at the activities that actually happen in a regular Apple retail store. They have very nice retail stores and the sales people there are very knowledgeable, that is true. However, they are not doing any rocket science and the sales efforts performed by these salespeople are not very different than a regular other electronics retail store around the corner. So it would be very strange when Apple’s retail stores would be mainly responsible for the $72b annual profits while most electronics retail stores around the corner (and the world) can barely survive.
That explains why Apple’s worldwide retail stores and other sales activities make a relatively small margin of 3.3%, just about the same margin global electronics retailers like Dixons or Media Market make on their local retail stores.
Apple’s EU Tax Case: €13b Additional Taxes to Pay
You probably heard about Apple’s recent EU tax case, in which the European Commission decided that Apple should pay an additional €13b in taxes to Ireland.
We have prepared a separate article on that case because otherwise, this article would even be much longer. But, at the core, that case is about Apple’s value distribution. In that article, you will learn what happened in that case and why Apple did what it did plus you will also learn why US multinationals, like Apple, are “forced” to stall billions of profits outside the US.
Consultants 500
Global Tax Talents, our tax-only job board, has been specifically designed to help job seekers find their dream tax job in just a few steps out of a pool of thousands of tax jobs.
However, Consultants 500 is more than a niche tax job board; it’s also a career hub with a 100% focus on tax jobs and tax resources. Via our tax directory, you can search for tax recruiters, tax firms, and tax automation software providers. So, all our visitors are 100% interested in the tax sector.
- Search for Tax Jobs, Tax Resources, Tax Recruiters, and more in the tax sector.
- Fine-tune your search to fulfill your needs and directly contact each other.
- Get more relevant results due to a 100% tax focus.
- Search for tax jobs at all sorts of employers.
- Designed for the tax job seeker, hassle-free searching and only showing relevant tax jobs as specified by you.
- Find your dream tax job now!
- Search Tax Recruiters, Tax Firms & Tax (Automation) Software.
- Increase lead generation & online visibility.
- Directly contact each other & get the job done.
- Contact us to get enlisted.
Follow Us